
Common statistical tests and how to use them in students' theses
Which statistical test is right?
When writing a thesis based on quantitative research – whether a seminar paper, a master’s thesis or a doctorate – one of the main challenges a student faces is how to choose the statistical analysis that fits the research hypotheses and questions. Statistical analysis is the tool we use to test whether patterns seen in the collected data (the sample) can be generalized to the wider population at a certain level of probability (the significance level). This test is the basis of induction – generalizing from the particular to the general, from the limited sample of participants collected for the study to the wider population about which we try to draw broad conclusions and contribute to a growing body of evidence- and data-based knowledge.
Take, for example, a study that wants to answer a simple research question: does physicians’ satisfaction with their career depend on their field of work? And does it differ between those who work in internal medicine and those in rehabilitation? To answer this, the researcher will need to compare the satisfaction of physicians working in an internal medicine department with those working in rehabilitation in Israel. Since the researcher cannot collect all internists and rehabilitation physicians in Israel – due to practical resource limits – time, money and access – they will have to settle for a sample representative of the broader population. The researcher will collect data on the satisfaction of the two populations (internists and rehabilitation physicians) and organize it as quantitative data for statistical processing. At this stage, the statistical test is the researcher’s way of deciding whether the differences observed between the two populations are large enough (or, in statistical terms, significant) to support a claim, for example, that internists are more satisfied with their careers than rehabilitation physicians, and that the observed differences did not arise by chance.
Sometimes it is even advisable to run statistical analyses beyond the research hypotheses and questions – exploratory analyses – in order to discover patterns and directions for follow-up studies. Such analyses are performed without prior planning and are not part of the main research objectives. They are used, for example, to examine relationships or differences among the full set of study variables, and can broaden the interpretation of the data and provide with caution further important information for the research field. Because of the risk of obtaining a significant result by chance in these tests, the researcher must adjust the significance level to the number and type of analyses. One common way to do this is, for example, a Bonferroni correction, which lowers the significance level (alpha) according to the number of comparisons or relationships tested.
In this article we will try to shed some light on some of the tests commonly used in student and researcher work: their purpose – what do they test? And when should each one be used?
Examples of statistical tests for testing research hypotheses
Independent Samples T Test
When is it used?
When you want to test whether there is a significant difference in means between two different (populations) groups that are independent of each other.
What are the test assumptions?
- This is a parametric test that requires the dependent variable to be quantitative, or at least measured on a quasi-interval scale.
- The population distribution is normal.
- The independent variable is on a nominal (categorical) scale and includes only two groups that form the basis of comparison.
Example:
Comparing the taste of protein drinks from Strauss versus Tnuva.
Example: SPSS output for an independent samples t test

Paired samples t test
When is it used?
This test is used to compare the means of the same participants at two different points in time or under two different conditions, and also for comparisons between pairs of participants (for example: couples in a relationship, or twins).
What are the test assumptions?
- This is a parametric test that requires the dependent variable to be quantitative, or at least measured on a quasi-interval scale.
- The population distribution is normal.
- There is a match between the measurements – comparisons are made for each participant between the different time points or between each pair.
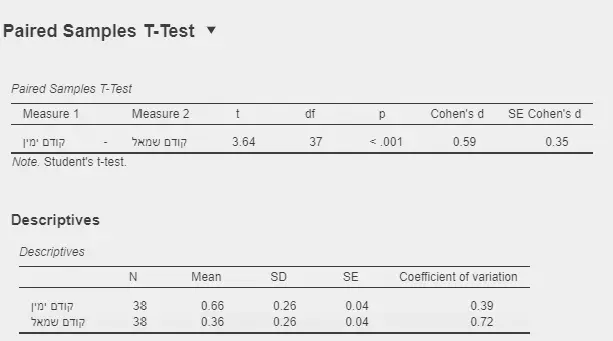
Possible use: Examining the effect of short-term psychological treatment on the tendency to ruminate (repetitive, prolonged thinking about problems or negative feelings without moving toward a solution). This test compares the tendency to ruminate before and after treatment.
Example: JASP output for a paired samples t test
Pearson and Spearman Correlations
When is it used?
To test the existence, strength and direction of a relationship between two variables.
What is the difference?
Possible use: Examining the relationship between hours of sleep and distraction while driving.
Example: SPSS output of a Pearson test
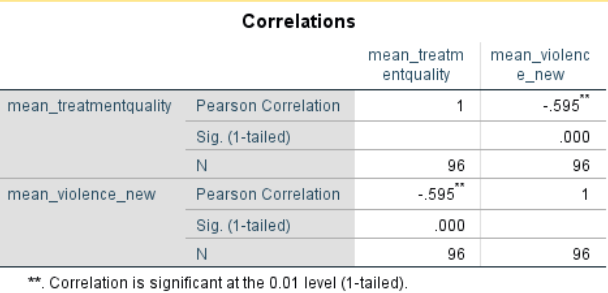
Example: possible APA-style report of a Pearson correlation matrix among different research variables

Chi-Squared test
When is it used?
The chi-squared test is used to examine a relationship or dependence between two categorical (nominal or ordinal) variables. The test checks whether the actual distribution of observations differs from the distribution expected if there were no relationship between the variables. Chi-squared is especially suitable when you want to test whether groups differ in the frequency of a certain phenomenon, or whether qualitative variables are dependent.
What are the test assumptions?
The samples must be independent of each other.
• The data must represent counts of cases rather than quantitative measurements.
• Make sure each cell in the table contains a sufficiently large number of observations (preferably at least 5 observations per cell).
Possible use: Examining the relationship between gender (male/female) and choice of study track (social sciences, humanities, exact sciences, medicine and health). In this case the chi-squared test examines whether the distribution of track choice differs between men and women beyond what would be expected by chance.
Example: SPSS output of a chi-squared test of independence

Simple Linear Regression
When is it used?
This test examines the relationship between an independent variable (predictor) and a quantitative dependent variable (predicted), and also allows you to predict the values of the dependent variable and build a prediction equation based on the relationship between the variables.
Test assumptions:
- Based on a parametric test, so the same assumptions as the Pearson test apply regarding the distribution of the quantitative dependent variable.
Possible use: Examining the prediction of average income based on a certain criterion (for example: IQ level).
Multiple Regression
When is it used?
When you want to predict a quantitative dependent variable from several independent variables and examine the contribution of each of them to the prediction.
Possible use: Examining the contribution of motivation, anxiety and parental support to academic success.
Logistic Regression
When is it used?
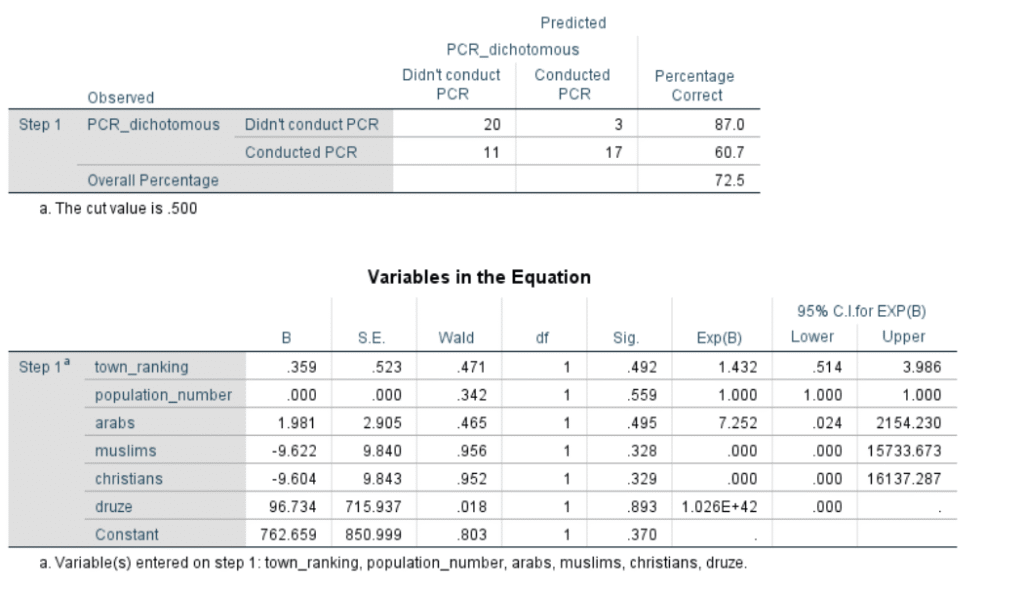
Logistic regression is suitable when the outcome of the dependent (predicted) variable is dichotomous (for example: success/failure); the goal is to predict the probability of an outcome occurring based on one or more independent variables.
Possible use: Predicting whether an oncology patient will survive or die within 5 years after a certain treatment.
Example of SPSS output for a logistic regression test
Hierarchical Regression
When is it used:
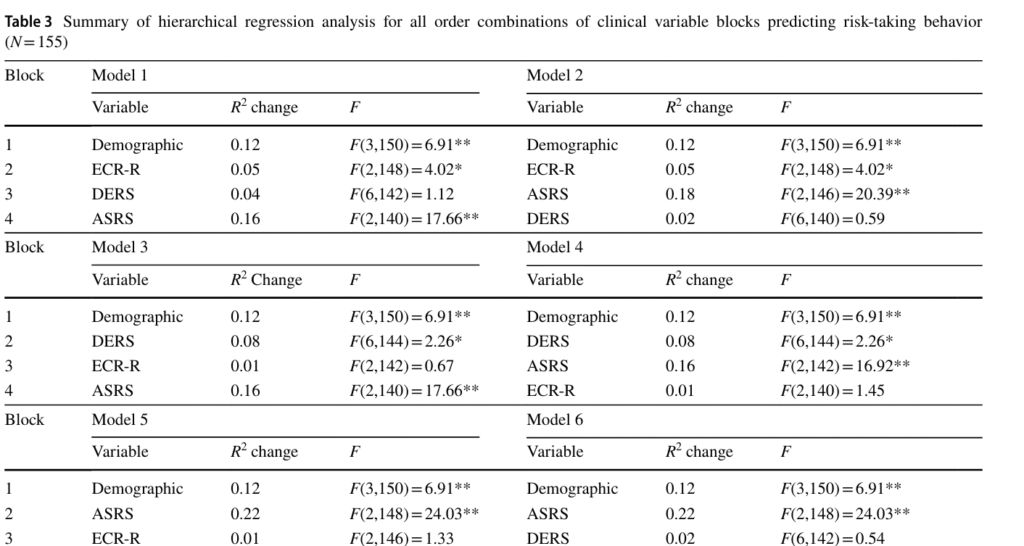
Possible use: Examining whether psychological variables (for example: ADHD symptoms) contribute to anxiety symptoms over and above the prediction obtained from other variables (for example: gender, the presence of a certain anxiety disorder).
Example: reporting a hierarchical regression in an academic paper
Analysis of Variance (ANOVA)
When is it used?
When you need to compare differences between more than two groups. Analysis of variance tests whether there are significant differences in any of the means, and if so, between which groups, using follow-up analyses (Post Hoc).
Possible use: Comparing satisfaction levels among students studying in three different departments in the same faculty.
.
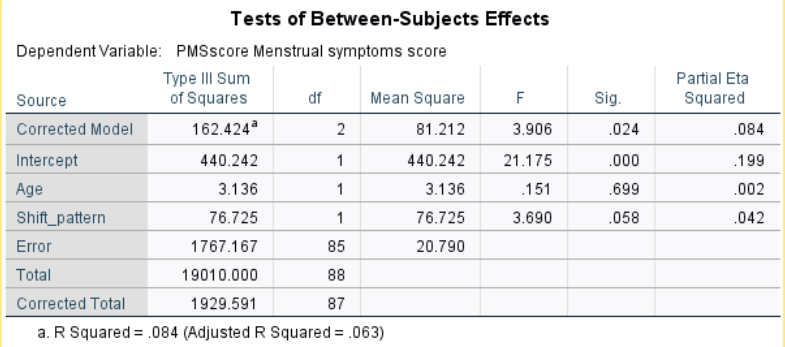
Example of SPSS output for the result of a two-way ANOVA
Analysis of Covariance (ANCOVA)
When is it used?
To examine true differences between groups while controlling for the effect of one or more confounding variables (covariates).
Example of possible use: Comparing the grades of students taught with two different methods while controlling for their level of achievement before the intervention began.
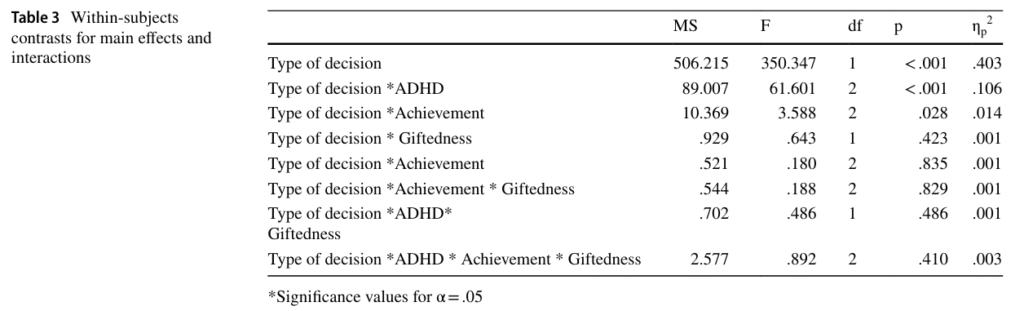
Example of a reporting table for a within-subjects analysis of variance according to APA style:
Why is it important to choose the right statistical test?
Choosing the right statistical test is one of the foundations of valid and reliable research. A wrong analysis can lead to misinterpretation of the findings, and even to the rejection of the academic work or of a paper submitted for publication, wasting valuable work that could have advanced significant knowledge in the field.
At Statisticaia we provide personal, professional support: you will receive proper guidance from a professional statistician in choosing and running the statistical test that fits your research questions and hypotheses, according to your variables and other parameters, including support in writing and reporting the results in the format accepted by academic rules.